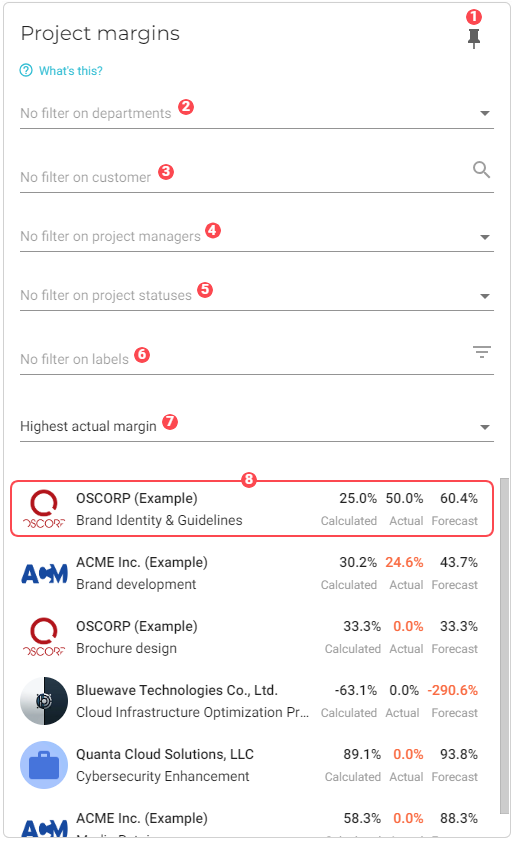
Project margins
This chart allows you to easily browse through a list of the profit margins for your active projects.
|
To ensure this chart is accurate, do the following:
|
|
Pin icon. Click to pin this chart to a board. |
||
|
By default, data from all departments is used in the dataset. See Filter data by departments to learn how to remove specific department data from the dataset. |
||
|
By default, data for all customers is used in the dataset. See Filter data by customer to learn how to remove specific customers from the dataset. |
||
|
By default, data for all project managers is used in the dataset. See Filter data by project managers to learn how to remove specific project managers from the dataset. |
||
|
By default, data for all project statuses is used in the dataset. See Filter data by project status to learn how to remove specific project statuses from the dataset. |
||
|
By default, all data is used in the dataset. See Filter data by label to learn how to filter the dataset by labels. |
||
|
Sort the list based on one of the following options:
|
||
|
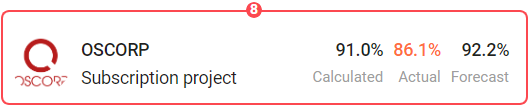
List of customer projects with margins. A project’s profit margin is presented three ways: calculated, actual, and forecast. Click the profit margin statistics to go to the project’s page: 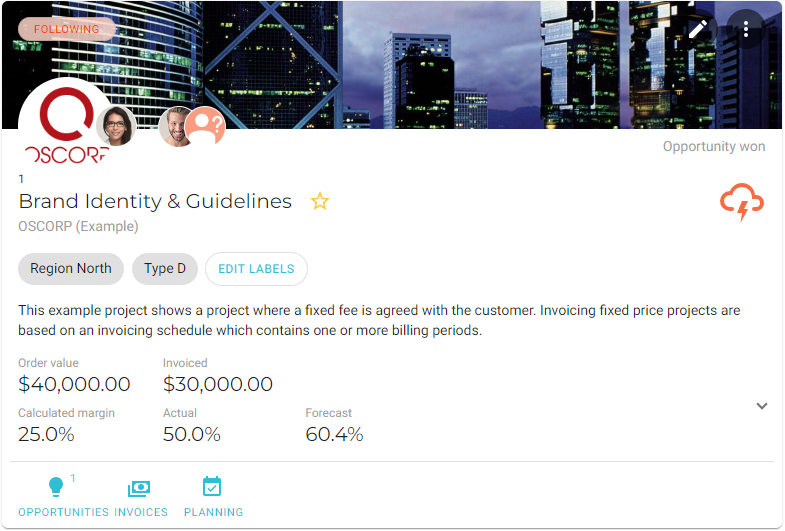
|


Filter data by departments
To select the departments whose data you want to visualize in the chart, do the following:
-
Click the
 Filter button for the department filter. A dialog window will display with a list of the departments that you have configured for your company.
 -
Select the departments that you want to add to the chart.
-
Click OK. The chart will refresh with the updated presentation.
Filter data by customer
To select the customers whose data you want to visualize in the chart, do the following:
-
Click the
Filter button for the customer filter. A dialog window will display with a list of your company’s customers. -
Select the customers that you want to add to the chart.
-
Click OK. The chart will refresh with the updated presentation.
Filter data by project managers
To select the project managers whose data you want to visualize in the chart, do the following:
-
Click the
Filter button for the project manager filter. A dialog window will display with a list of your company’s project managers. -
Select the project managers that you want to add to the chart.
-
Click OK. The chart will refresh with the updated presentation.
Filter data by project status
To filter the chart’s data by project status, do the following:
-
Click the
Filter button for the project status filter. A dialog window will display with a list of the project statuses. -
Select the statuses that you want to add to the chart.
-
Click OK. The chart will refresh with the updated presentation.
Filter data by label
To filter the chart’s data by labels, do the following:
-
Click the
Filter button for the labels filter. A dialog window will display with a list of active labels. -
Select the labels that you want to add to the chart.
-
Click OK. The chart will refresh with the updated presentation.
Show the actual margin statistic
A project’s profit margin is presented three ways: calculated, actual, and forecast.
If you want to display the actual margin statistic, do the following:
-
Go to the back office, scroll down to the Settings section, and click Charts.
You must have the Support staff role in order to access the back office. -
Click Project margins to display the chart’s settings.
-
Click the Show actual margin checkbox and then click Save. The actual margin statistic will now display on the chart.