Calculation
A budget, which VOGSY calls a calculation, lists the activities and costs required to complete a deliverable as well as the revenue the deliverable should bring in once it is completed and the customer is invoiced.
Activities are tasks that your team needs to perform to complete the deliverable. Costs refer to the prices of materials or services needed to complete the deliverable.
Deliverables require calculations so that users can track time and other costs against the deliverables and so that project managers can monitor project budgets.
By default, the calculation that you add to a deliverable is activity-based. This is called the top-down approach to calculations, and it means that when you allocate a resource to an activity, the activity’s cost and sales rates are used when making calculations such as costs, sales, and margins.
VOGSY offers another approach that is called the bottom-up approach. In this case, the cost and sales rates of the allocated resources are used when making calculations such as costs, sales, and margins. When using this approach, the activity’s cost and sales rate is based on the average cost and sales rates of the allocated resources. These totals are also used to determined the number of unallocated hours that remain to the calculation.
Using the bottom-up approach
There are two changes you must make in order to activate the bottom-up approach for your project.
| This approach can only be activated when you create the project, and once the project is created with this approach activated, it cannot be undone. |
The first step is to go to the back office and open the Project settings page. Scroll down to the Calculate budgets ‘bottom up’ by default checkbox and select it. Click Save.
The second step is to create the project. There will be a Calculate budgets ‘bottom-up’ checkbox on the Create project form; select it, and after you have completed the other sections of the form, click Save.
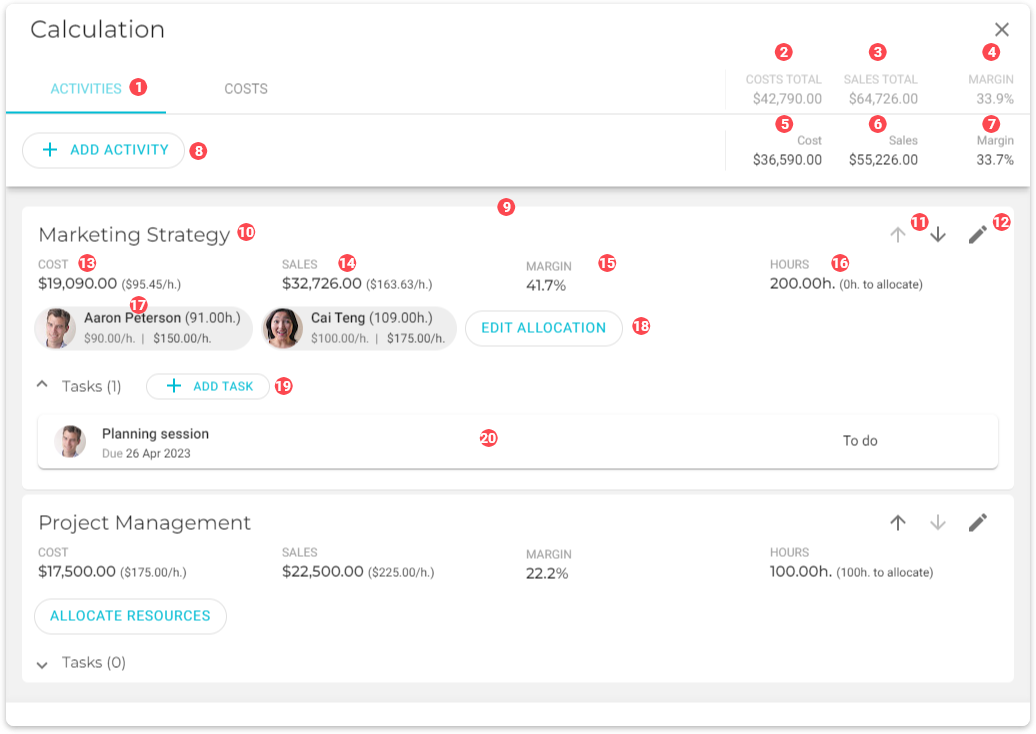
Because the bottom-up approach uses different data than the top-down (default) approach, the data that displays on the Calculation has a few key differences. The differences are:
-
The activity’s cost, sales, margin and hours calculations are based on the average cost and sales rates of the allocated resources. For example, Aaron Peterson’s cost rate is $90.00 per hour and Cai Teng’s cost rate is $100 per hour. The activity’s cost rate is calculated as $95.45 per hour.
-
The allocated resource’s cost rate and sales rate are displayed along with their picture and allocated hours.
See Activities tab field descriptions for a complete example.
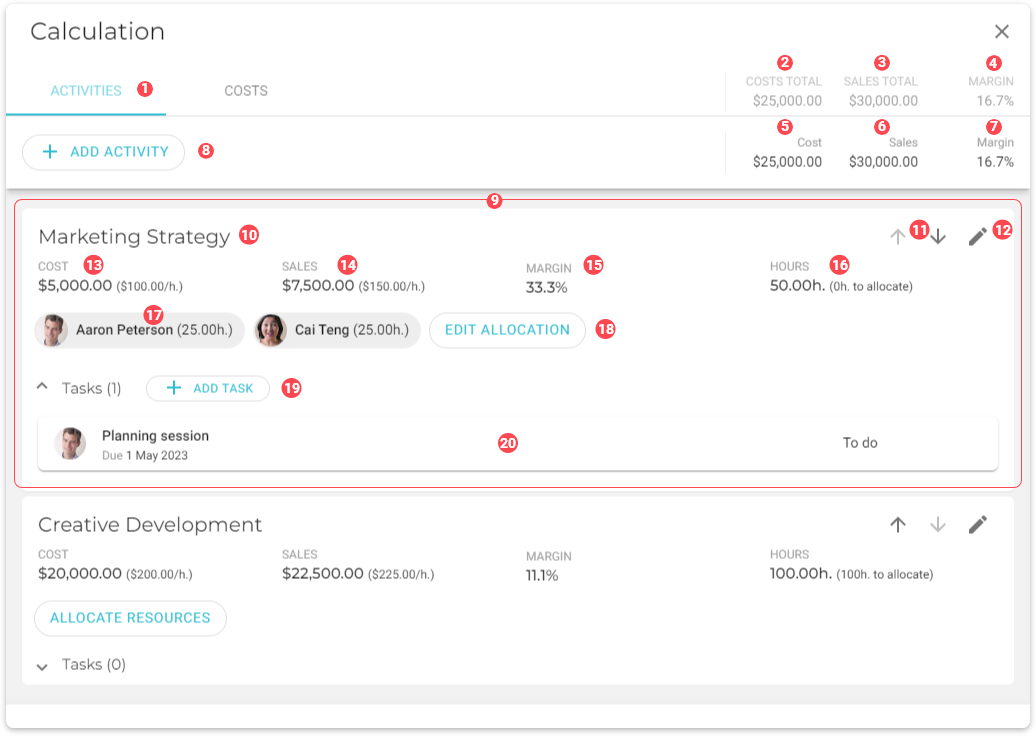
Activities tab field descriptions
Top-down approach
Bottom-up approach
|
Activities tab |
||
|
Total outlays for the project based on activities and costs. |
||
|
Total sales resulting from completing the project. |
||
|
The profit margin for the project. |
||
|
Total outlays for the deeliverable based on activities and costs. |
||
|
Total sales resulting from completing the deliverable. |
||
|
The profit margin for the deliverable. |
||
|
Click this button to add an activity. |
||
|
Activity card, whih displays all data for the specific activity. A deliverable can contain one or more of these. |
||
|
Name of the activity. |
||
|
Priority arrows. Click these to move the activity card up or down the list. |
||
|
Edit button. Click to display the edit form. |
||
|
Calculated outlays to perform the activity. This is calculated by multiplying the cost rate of the allocated resources by the total estimated hours ( |
||
|
Total calculated sales rate. This is calculated by multiplying the sales rate of the allocated resources by the total estimated hours ( |
||
|
Profit margin. |
||
|
The estimated number of hours allocated to complete the activity. |
||
|
A resource assignment, which contains the following:
|
||
|
Click this button to add a resource to the activity. Displays a form where you can pick a resource to perform the activity. |
||
|
Click this button to add a task to the task section of the activity card. |
||
|
Task cards that are associated with the activity to which they are attached. |
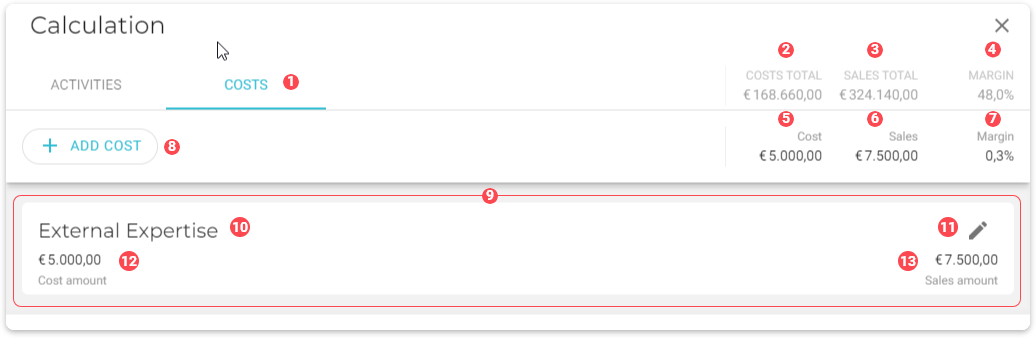
Costs tab field descriptions
|
Costs tab |
|
Total costs for the project based on activities and costs. |
|
Total sales resulting from completing the project. |
|
The profit margin for the project. |
|
Total costs for the deeliverable based on activities and costs. |
|
Total sales resulting from completing the deliverable. |
|
The profit margin for the deliverable. |
|
Click this button to add a project cost. |
|
Cost card, which displays all data for the specific cost. A deliverable can contain one or more of these. |
|
Name of the cost type. |
|
Edit button. Click to display the edit form. |
|
Cost amount. |
|
Amount charged to the customer for the cost amount. |