Margins
VOGSY automatically tracks all hours and costs spent against a project’s budget, and shows you the calculated and actual margins based on sales and cost rates. It does the same at the level of each deliverable.
Margins at the project level
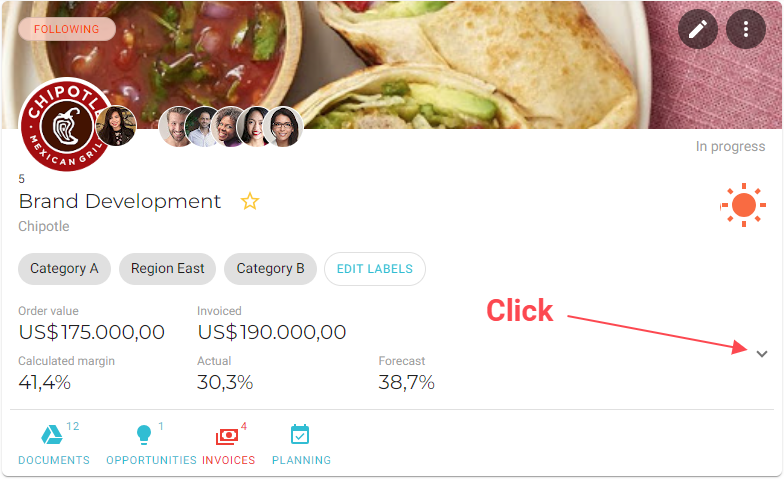
To view a project’s margin data and statistics, click the ![]() expander arrow:
expander arrow:
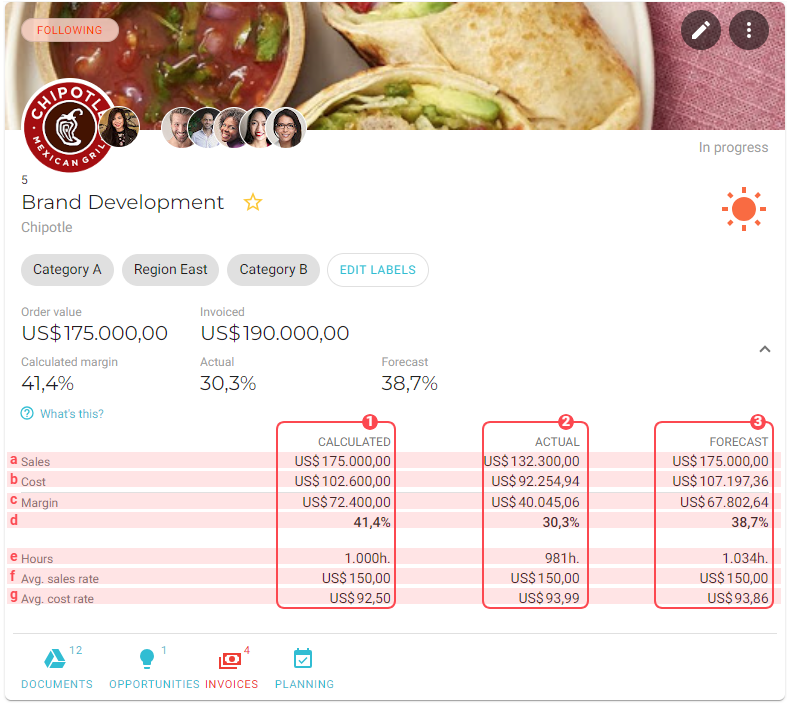
The expanded data that displays includes the following:
|
The calculated data, based on hard bookings. |
|
The actuals data, based on invoices and time sheets. |
|
The forcasted data, based on soft bookings. |
|
The sales data |
|
The costs data |
|
The margin data cash value |
|
The margin data percentage value |
|
The hours data |
|
The sales rate data, averaged |
|
The cost rate data, averaged |
Margins at the deliverable level
To view a deliverable’s margin data and statistics, click it’s margin gauge:
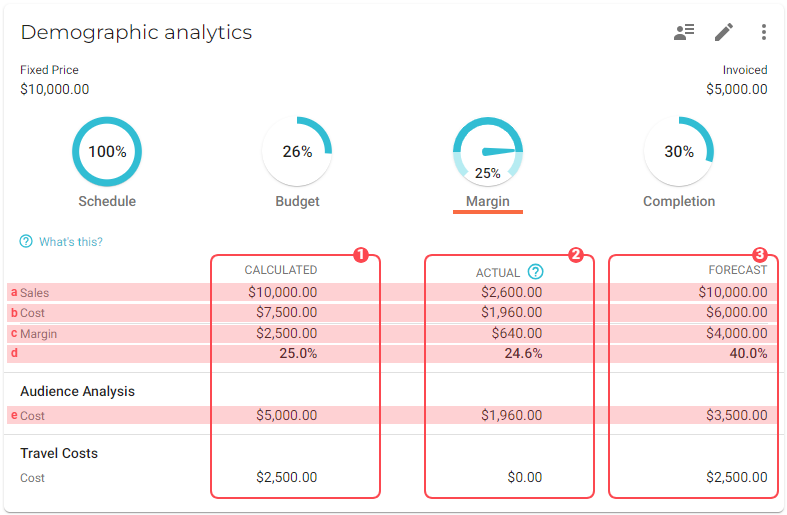
The information that displays includes the following:
|
The calculated data, including the profit margin, displayed as cash value ( |
|
The actuals data, including the profit margin, displayed as cash value ( |
|
The forcasted data, including the profit margin, displayed as cash value ( |
Determining what the margin guage’s value represents

The percentage value displayed in the deliverable’s margin gauge can be based on the deliverable’s actual margin or on its margin forecast. By default it displays the actual margin. To change this, do the following:
-
Go to the back office and open the Project settings page.
You must have the Support staff role in order to access the back office. -
Located the
Margin indicators are based onsection. -
Select the appropriate check box and then scroll down and click Save.
Calculated margin
The calculated margin (![]()
![]() ) is calculated depending on the invoicing method:
) is calculated depending on the invoicing method:
-
Time & Material: The total amount of calculated costs divided by the calculated sales (

 ).
). -
Fixed Price: The total amount of calculated costs divided by the total value of the invoicing schedule plus the amounts from manually created invoices(
). -
Subscription: The total amount of calculated costs divided by the order value of the deliverable (
).
Calculated costs (![]()
![]() ) are based on the calculated activities of the deliverable. In this example there are two activities calculated:
) are based on the calculated activities of the deliverable. In this example there are two activities calculated:
| Activity | Calculated cost rate | Hours calculated | Costs |
|---|---|---|---|
Developing |
$100 |
200 |
$20,000 |
Design |
$90 |
100 |
$9,000 |
Total costs |
$29,000 |
The calculated cost (![]()
![]() ) of an activity is displayed beneath the activity.
) of an activity is displayed beneath the activity.
Actual margin
A deliverable’s actual margin is based on its actual costs and actual sales.
Actual costs
Actual costs are based on all hours spent on the deliverable. The total number of hours spent is multiplied by the cost rate of the employee who submitted the spent hours.
The following example shows how the actual costs are calculated. In this situation, two employees tracked time on a fixed price deliverable:
| Employee | Cost rate employee | Activity | Hours spent | Costs |
|---|---|---|---|---|
Mikey Johnson |
$90 |
Developing |
32 |
$2,880 |
William Smith |
$100 |
Design |
12 |
$1.200 |
Total costs |
$4,080 |
Actual sales
For fixed-price deliverables, the fixed price amount equals the actual sales amount.
To have a realistic actual sales value, VOGSY calculates the actual margin in proportion. How to determine the proportion can be configured in the Project settings.
There are three options to choose from:
-
Schedule: The percentage of the schedule is used. For example: If 25% of the time is passed, 25% of the total amount of the invoice schedule will be used.
-
Budget: The percentage of budget spent is used. For example: when 30% of the budget is used, 30% of the total amount of the invoice schedule is used for calculating the actual margin.
-
Completion: The percentage of completion determines the actual sales. The completion can be set manually by tapping on the completion indicator. When the deliverable has a completion percentage of 75%, the actual sales will be 75% of the total amount of the invoice schedule.
The default setting is
Completion.
Based on the above example this would be the calculation of the actual margin, when the total amount of the invoicing schedule is $37,500 and the completion is 15%:
Actual costs |
Hours spent x cost rate employee |
$4,080 |
Actual sales |
Invoicing schedule ($37,500) x Completion (15%) |
$5,625 |
Actual margin ($) |
Actual sales - Actual costs |
$1,545 |
Actual margin (%) |
Actual margin ($) / Actual sales |
27.5% |
Margin forecast
Forecasted margins are a snapshot of your project’s financial future. They are calculated based on the invoicing method of the project’s deliverables as well as the amount of hours that have been worked by all resources associated with the deliverable. This calculation offers a full view of your project’s potential income and expenses, giving you a clear financial forecast.
Time and Materials deliverables
The margin forecast for Time and Materials projects is calculated in the following manner: Forecasted sales - Forecasted costs.
-
Forecasted sales is calculated by adding the following:
-
Planned hours
-
Submitted hours for the current week
-
Approved hours
Planned hours
$8000
Submitted hours
$5000
Approved hours
$7000
Forecasted sales
$20000
These amounts are based on the sales rates of the activity calculations.
-
-
The same hours used to calculate the forecasted sales are also used to calculate the forecasted costs, except the cost rates of the assigned resources are used.
Planned hours
$5000
Submitted hours
$3125
Approved hours
$4375
Forecasted costs
$12500
-
The difference between the forecasted sales and the forecasted costs is the margin forecast.
Forecasted sales
$20000
Forecasted costs
$12500
Margin forecast
$7500
-
The margin forecast percentage is calculated by dividing the forecasted sales into the margin forecast.
Margin forecast
$7500
Forecasted sales
$20000
Margin forecast percentage
37.5%
Fixed price projects
The margin forecast for fixed price projects is calculated in the following manner: Forecasted sales - Forecasted costs.
-
The forecasted sales is derived from the project’s invoice schedule:
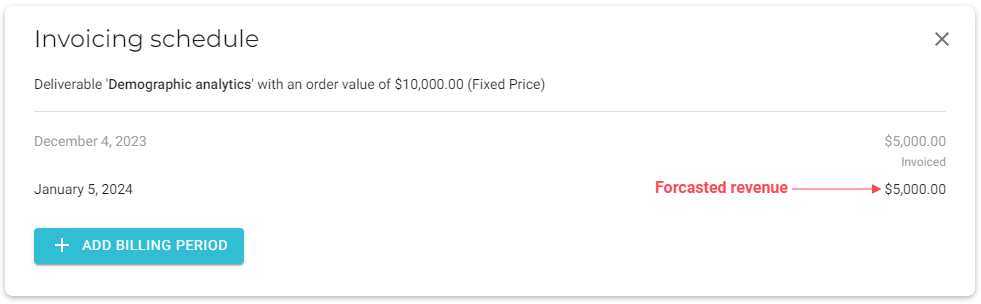
-
To calculate the forecasted costs, the following hours are used:
-
Planned hours
-
Submitted hours for the current week
-
Approved hours
Planned hours
$500
Submitted hours
$1000
Approved hours
$1000
Forecasted costs
$2500
These amounts are based on the cost rates of the assigned resources.
-
-
The difference between the forecasted sales and the forecasted costs is the margin forecast.
Forecasted sales
$5000
Costs
$2500
Margin forecast
$2500
-
The margin forecast percentage is calculated by dividing the forecasted sales into the margin forecast.
Margin forecast
$2500
Forecasted sales
$5000
Margin forecast percentage
50%