Projects - weather changes
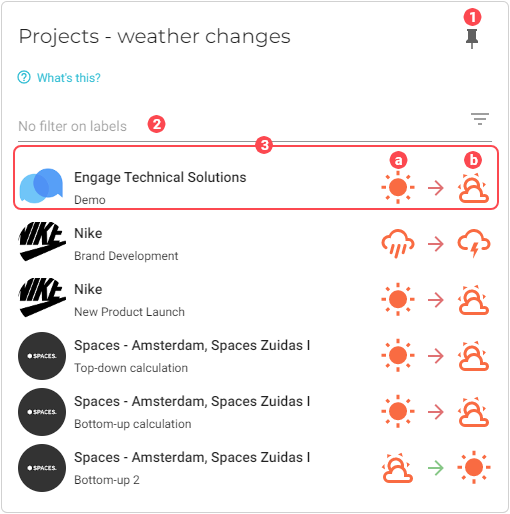
This chart displays an overview of the ‘weather condition’ changes that have happened over the last seven days for each project in your roster so that you can get a sense of the progress being made.
By default the weather condition calculation is based on margin, but you can configure it with the Project Settings back office module to be based on a schedule. See Deliverables to learn the difference between a margin and a schedule.
|
To ensure this chart is accurate, do the following:
|
|
Pin icon. Click to pin this chart to a board. |
|
By default, all data, regardless of applied labels, is used in the dataset. See Filter data by label to learn how to restrict the data based on labels. |
|
Project. Shows what the weather condition was seven days ago ( Click the project to open its project page. 
|


Filter data by label
To select the data you want to visualize in the chart based on one or more labels, do the following:
-
Click the
 Filter button for the Labels filter. A dialog window will display with a list of labels that have been applied to opportunities.
 -
Select the labels that you want to add to the chart.
-
Click OK. The chart will refresh with the updated visualization.