Outstanding invoices
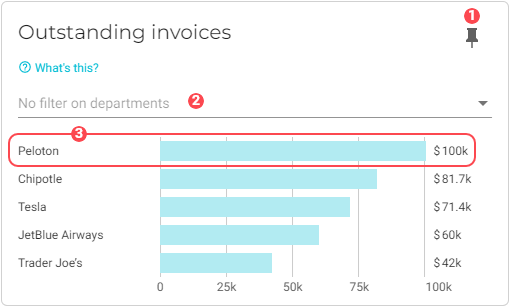
This chart shows you each of your customers’ outstanding invoices ordered by the amount due. It also indicates the age of the invoices.
| To ensure this chart is accurate, be sure to generate invoices as necessary and to mark them as PAID when appropriate. |
|
Pin icon. Click to pin this chart to a board. |
||||||
|
By default, data from all departments is used in the dataset. See Filter data by departments to learn how to remove specific department data from the dataset. |
||||||
|
Invoice graph. Displays the name of the customer and the invoice amount. The color of the bar graph indicates the age of the invoice:
Click the graph to view more details about the invoice: 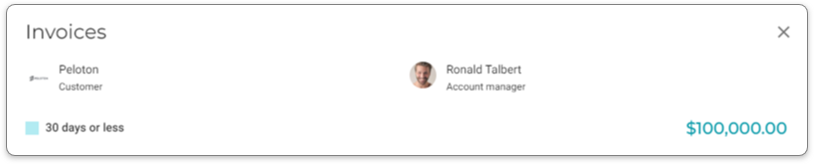
Click invoice age to view further details: 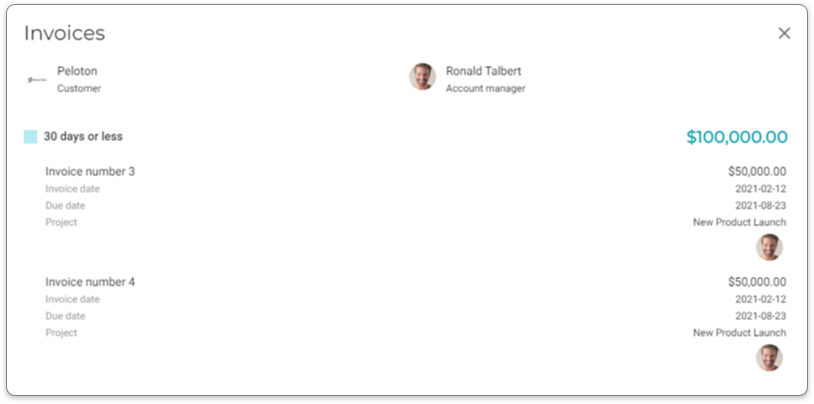
|


Filter data by departments
To select the departments whose data you want to visualize in the chart, do the following:
-
Click the
 Filter button for the department filter. A dialog window will display with a list of the departments that you have configured for your company.
 -
Select the departments that you want to add to the chart.
-
Click OK. The chart will refresh with the updated presentation.