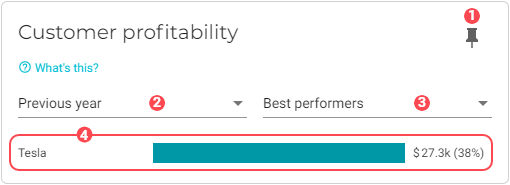
Customer graph. A bar graph displays for each customer with an active project. Click the graph to view a profile summary:
-
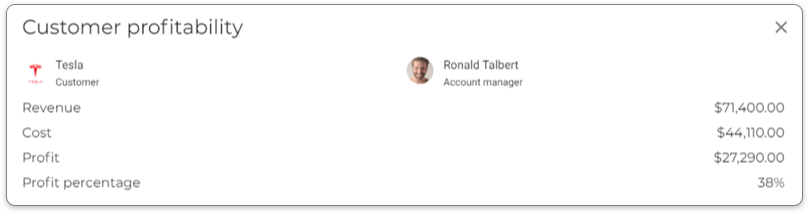
Cost is calculated adding the following sums:
-
For Time and Materials deliverables, the costs of time entries.
-
For Time and Materials deliverables with paid purchase invoices, the cost of the paid purchase invoices.
-
For Time and Materials deliverables with approved expenses, the cost of the expenses.
-
For closed projects, the costs of time entries from Fixed Price deliverables.
-
For closed projects with paid purchase invoices, the cost of the paid invoices.
-
For closed projects, the cost of expenses from Fixed Price deliverables.
-
Any costs booked via provisions.
-
Revenue is calculated by adding the following proceeds:
-
For Time and Materials deliverables, the revenue from invoiced time entries, purchase invoice distributions, and expenses.
-
For closed projects, the revenue from time entries on Fixed Price deliverables.
-
Any revenue booked from provisions
-
Profit is calculated by subtracting Cost from Revenue.
-
Profit percentage is calculated based on spent hours and revenue over the selected period.