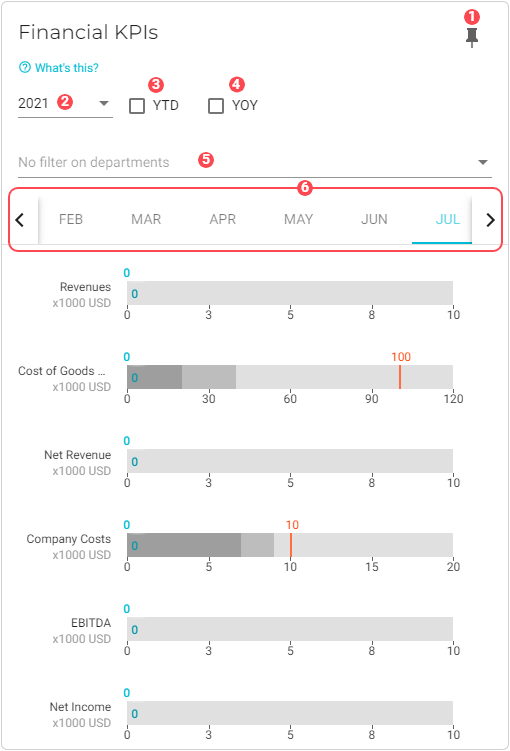
Financial KPIs
This chart shows the target budget and the realization per month for each KPI.
You can configure financial KPIs according to your own business needs with the Charts back office module.
| To ensure this chart is accurate, be sure to set and track your financial KPIs and targets. |
|
Pin icon. Click to pin this chart to a board. |
|
Year selector. Data from the selected year will be used to generate the graphs. |
|
Select this option to view the KPI totals up to the selected month. |
|
Select this option to compare the current year’s results to the results from the previous year. |
|
By default, data from all departments is used in the dataset. See Filter data by departments to learn how to remove specific department data from the dataset. |
|
Month selector. Click the month to view its KPI graphs. |


Filter data by departments
To select the departments whose data you want to visualize in the chart, do the following:
-
Click the
 Filter button for the department filter. A dialog window will display with a list of the departments that you have configured for your company.
 -
Select the departments that you want to add to the chart.
-
Click OK. The chart will refresh with the updated presentation.