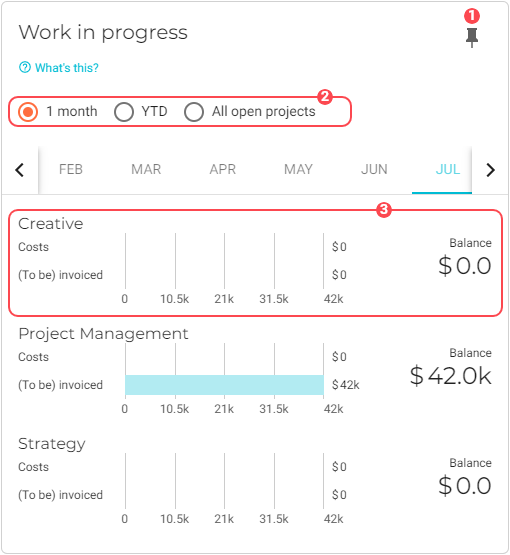
Work in progress
This chart compares, for each department, the actual costs made to the amount already invoiced as well as what’s left to be invoiced. Use the insights from this chart to improve your invoicing process and your cash flow.
|
To ensure this chart is accurate, do the following:
|
|
Pin icon. Click to pin this chart to a board. |
|
Visualization filter. You can display data from the selected month (Month), you can include all data up to the selected month (YTD), or you can include data from all open projects. |
|
Department graph. A graph displays for each department in your company. The Click the chart to display more details: 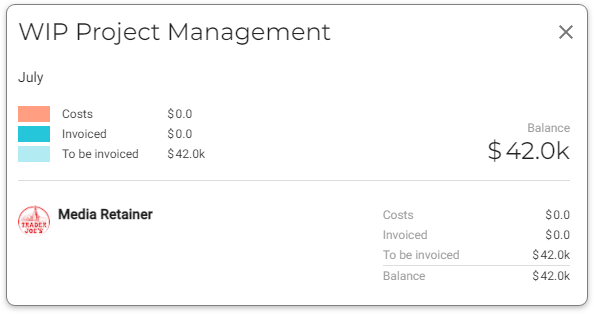
Click on a project to view its card: 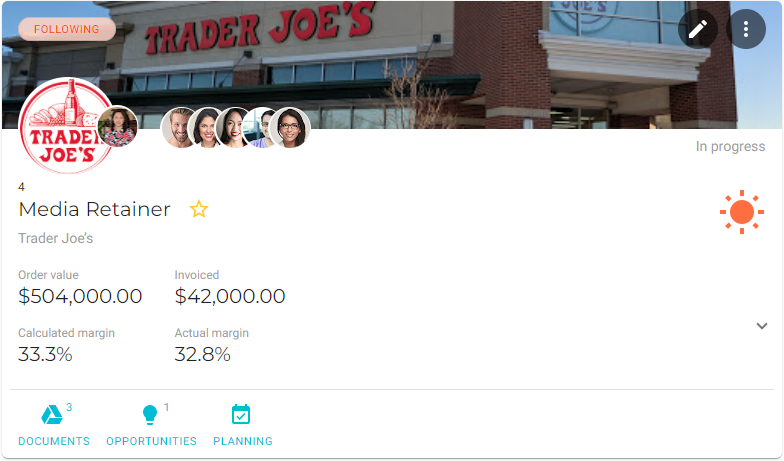
|


