Order intake
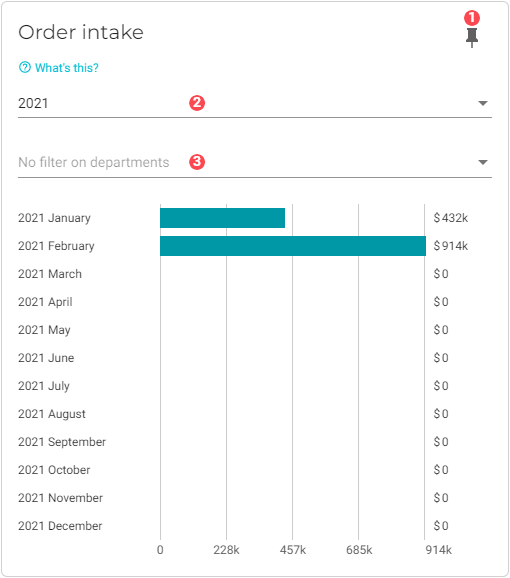
This chart shows the total order value of new deliverables by month. This is a very important indicator of your ability to make future billable hours and to utilize resources efficiently.
A project has to be in the Win stage before the order value of its deliverables will be added to this chart. If the project is in the Win stage when the deliverable is created, the deliverable’s order value will be added to the month of the deliverable’s creation. So if the deliverable was created in March 2020, it’s order value will be added to the chart for the month of March 2020.
If, however, the deliverable belongs to a project that is still in the Pending opportunity stage, the deliverable’s order value will not be added to the chart until the project hits the Win stage. At this point the deliverable’s order value will be added to the current month, the 'win' month. For example, let’s say a deliverable is created in March 2020, but the project to which it belongs is in the Pending opportunity stage. The project is moved to the Win stage in April 2020. In this scenario, the deliverable’s order value will be added to the April 2020 dataset.
|
To ensure this chart is accurate, do the following:
|
|
Pin icon. Click to pin this chart to a board. |
|
Time Period selector. You can select the current year (ie, 2020) or the current year and the previous year (ie, 2019-2020). |
|
By default, data from all departments is used in the dataset. See Filter data by departments to learn how to remove specific department data from the dataset. |


Filter data by departments
To select the departments whose data you want to visualize in the chart, do the following:
-
Click the
 Filter button for the department filter. A dialog window will display with a list of the departments that you have configured for your company.
 -
Select the departments that you want to add to the chart.
-
Click OK. The chart will refresh with the updated presentation.