Progress visualization
VOGSY uses a set of weather icons to provide a quick and intuitive way to visually assess the overall health of an opportunity or project.
This system allows you to browse quickly through your projects and determine if you want to deep-dive into a project.
The meaning and function of the weather indication system differs slightly between opportunities and projects:
-
For projects the weather indicator system reflects either a project’s overall performance or its margin. To choose which factor is used, see Set up the progress visualization feature.
-
For opportunities the weather indicator system is based on the progress of each opportunity as it passes through the sales funnel.
Progress visualization for projects
For projects the weather indicator system reflects either a project’s overall performance or its overall margin. You can configure VOGSY to use the project’s margin or its schedule to make its progress calculations. By default, VOGSY uses the schedule.
To set which method to use, do the following:
-
Go to the back office and select Project settings
-
Scroll down to the Weather indicator fine tuning section, where you will find the Base project weather on option.
-
Select the option (Schedule or Margin) you want to use and then scroll down and click Save.
| Companies that charge by the hour should answer the following question before deciding which measurement to use: What makes a project healthy? If the answer is A good project margin (which is usually the case if the project has fixed charges) then you should use the Margin for the progress calculation. If the answer is A balanced project where the time, budget, and completion rates are in sync then you should choose the Schedule for the progress calculation. |
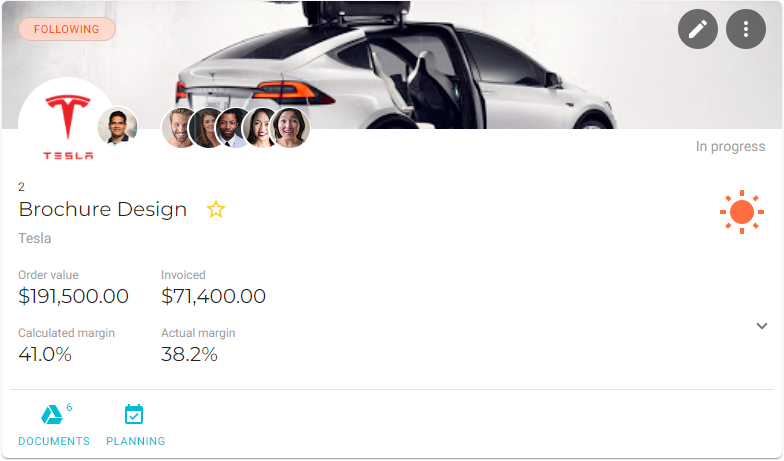
Each project card displays a progress visualization icon that reflects the current disposition of the project.
According to VOGSY’s philosophy of project management, an effective and healthy project is one that progresses according to its initial plan, predictably advancing on time, on budget, and within the calculated profit margin.
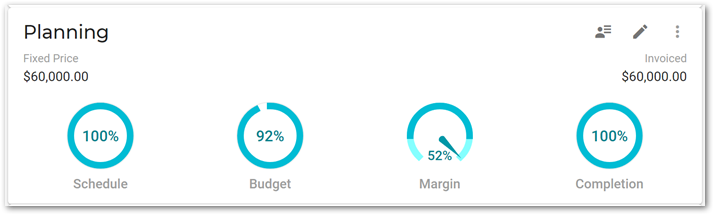
VOGSY therefore keeps track of the following financial measurements:
-
Schedule: This percentage shows how much time is left, based on the start and finish date of the deliverable.
-
Budget: Each deliverable has calculated activities or no-labor related costs, also named 'Budget'. This indicator shows the utilization of the budget.
-
Margin: Shows either the actual margin, or the forecasted margin, depending upon how you have the margin indicator set.
-
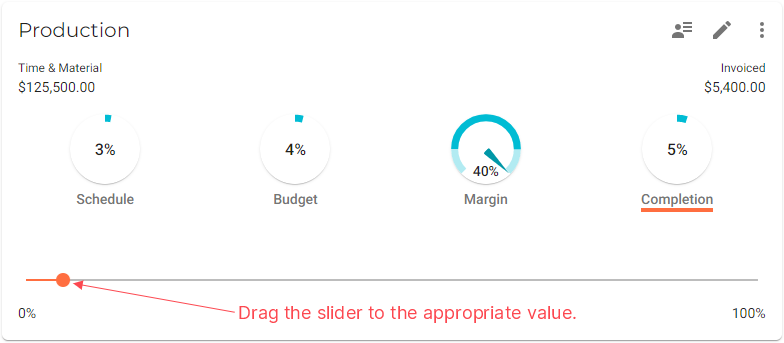
Completion: The completion percentage reflects the progress of the deliverable and the amount of work remaining. Since this progression is not based on time or budget usage, it can be set manually. To update the gauge, you can either click and drag the slider to the desired value, or use the arrow keys on your keyboard to adjust the slider.
The completion percentage can also be used to calculate the actual sales amount for fixed price deliverables, providing a realistic calculation of the actual margin.
Companies that have fixed charges should keep a close eye on the completion measurement as well. Besides being used as part of the calculation to determine the overall health of a project, the calculation measurement is also used to calculate project margins and work in progress.
If these measurements are in sync with one another — for example, if 50% of the available time has passed, based on start/finish date, and you have spent 50% of the budget, and the work completed (and invoiced) is also 50% — then you can be confident that your project is on schedule.
Conversely, if these measurements are out of whack, then you have an early warning that the project is not progressing healthily, and you should go about finding out why.
Multiple deliverables
Since projects can have multiple deliverables, the order value of a deliverable determines its weight within the weather indication system: the higher the order value, the more weight the deliverable carries in the determination of the project’s overall health.
Notifications
When there is a weather change, all followers of the project will get a notification on their feed.
The Projects - weather changes chart
This chart shows you a condensed overview of all weather changes of the past seven days. It shows per project the previous and current weather status, which gives you an indication of the progression of the project. If you want more detailed information of the project’s progress, simply tap on a weather change icon. This will display the project card where you can get a total overview of how each deliverable is progressing with regards to time, budget, and completion.
Progress visualization for opportunities
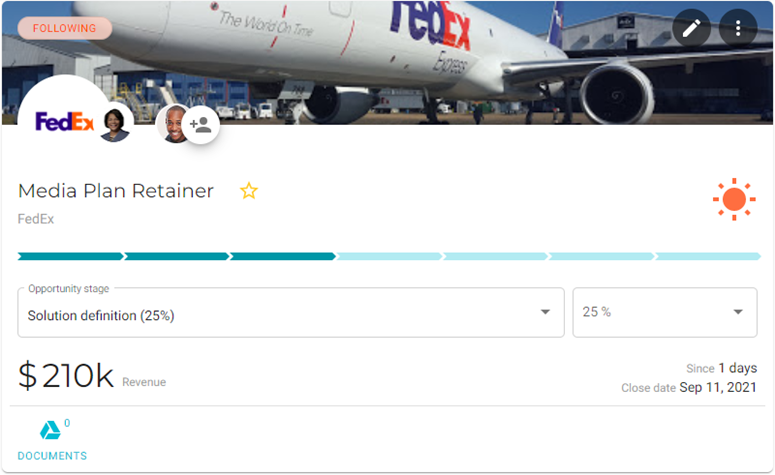
The weather indication system for opportunities is based on the time it takes the opportunity to pass through the sales funnel. The icon that displays represents the status of the opportunity, based on its current stage and age, in comparison to the historical rate of progression of similar opportunities. A ‘sunny’ icon means the opportunity is passing through the sale funnel at an appropriate rate; the ‘thunder cloud’ icon means the opportunity is passing through the sales funnel too slowly, or not at all.
| Since the progress rate for opportunities might differ between companies, you can configure the lead times in the VOGSY back office. |
The weather indication icons allow you to quickly scan a large number of projects and opportunities to determine which ones require attention. The Opportunities - Weather changes chart shows you an overview of all weather change events of the past seven days. Weather indication settings